

Bitcoin (BTC) price action is offering mixed signals after hitting $80,000 as traders diverge on market trajectory.
Key points:
- Bitcoin weekly relative strength index (RSI) reaches 58.3, repeating a bullish divergence that accompanied the end of the 2022 bear market.
- Daily RSI values reach their most “overbought” since November 2024 near 83.
- Stochastic RSI prints a key crossover but avoids copying previous zero-level bear-market lows.
Weekly RSI echoes Bitcoin’s 2022 bear-market bottom
Relative strength index (RSI) data across daily, weekly and two-month time frames has added to the debate over whether last week’s 25% rebound by Bitcoin will endure.
RSI is a classic indicator for trend momentum. It uses an asset’s average gain or loss over a given lookback window, normally 14 days, to determine the strength of its current trend momentum. For Bitcoin, bullish divergences with price, where RSI makes higher highs while BTC/USD makes lower lows, have accompanied the start of major trend inflections.
In mid-2022, around six months before the end of Bitcoin’s last bear market, weekly RSI began a bullish divergence, locking in higher lows while BTC/USD saw lower lows. Throughout 2026, a similar pattern emerged, data from TradingView shows.
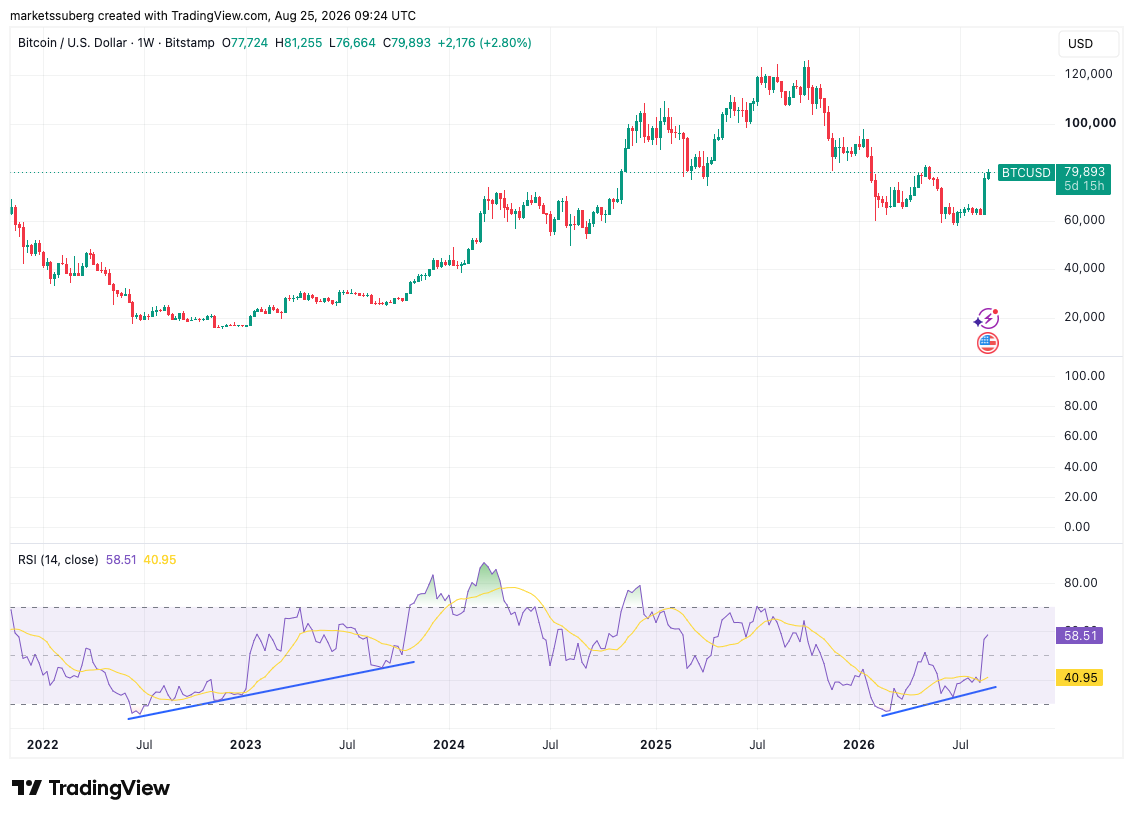
BTC/USD one-week chart with RSI bullish divergences. Source: Cointelegraph/TradingView
While short-term RSI signals present a less reliable picture of overall price trends, weekly signals have led some to rethink the status of the current bear market.
“Weekly is the timeframe that matters here, that’s where you read the secular trend and the cycle inflection points,” Jamie Coutts, chief crypto analyst at Real Vision, wrote in a post on X on Tuesday.
Coutts described weekly bullish divergences as having “real weight,” citing price upside that resulted from previous divergence events.
Weekly RSI currently measures 58.3, its highest levels since BTC/USD hit its latest all-time high of $126,200 in October 2025, having broken through a trend of lower highs. On daily time frames, RSI is now in “overbought” territory at 82.93.
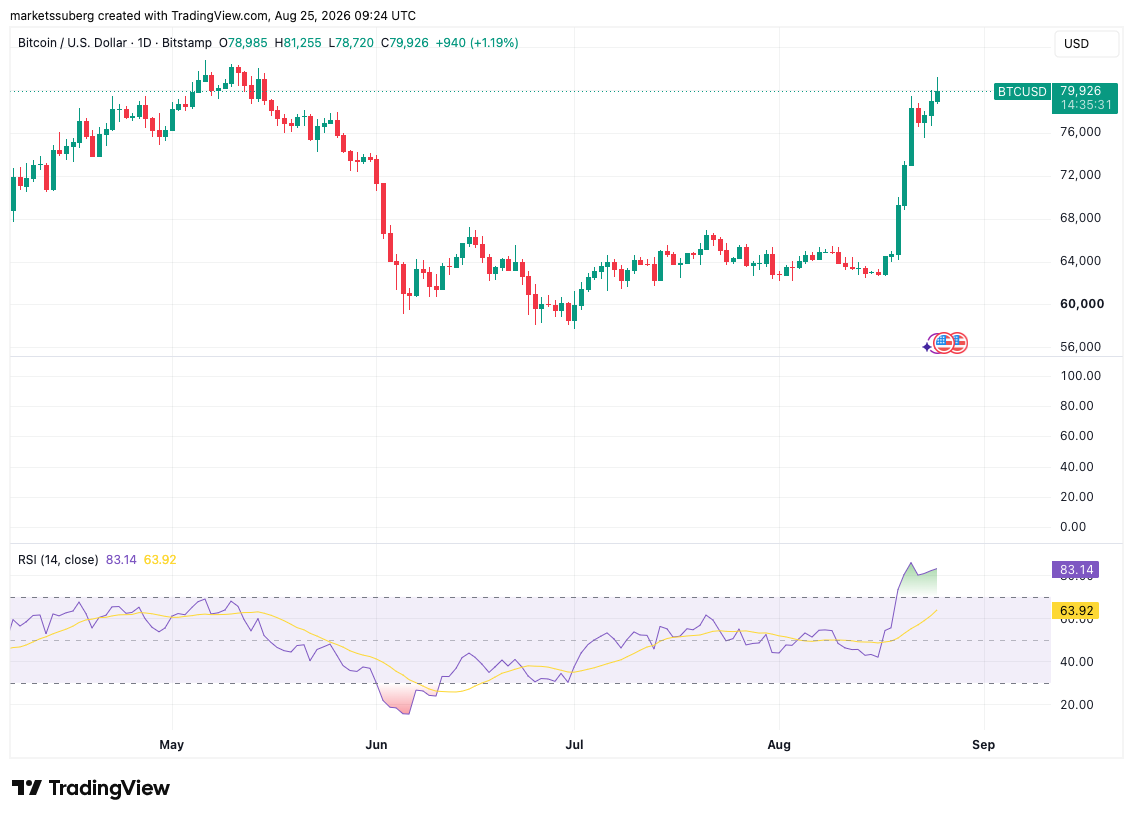
BTC/USD one-day chart with RSI data. Source: Cointelegraph/TradingView
Market participants are split over the implications of the daily readings, which are the highest since November 2024. Some see RSI giving a warning sign of an imminent reversal, while others point to the fact that historically, Bitcoin uptrends have been accompanied by multiple “overbought” periods, where RSI is above 70.
In his latest analysis, Jonatan Randin, senior market analyst at crypto trading platform PrimeXBT, flagged more similarities to late 2022. At the time, daily RSI increased from 40 to 90 over a single weekly candle.
“An extreme move like this usually signals the start of something new,” he told X followers.
“It doesn’t necessarily mean that the bear market is over but it is telling us something. I think what it’s trying to tell us is that we are about to enter a new phase of this cycle.”
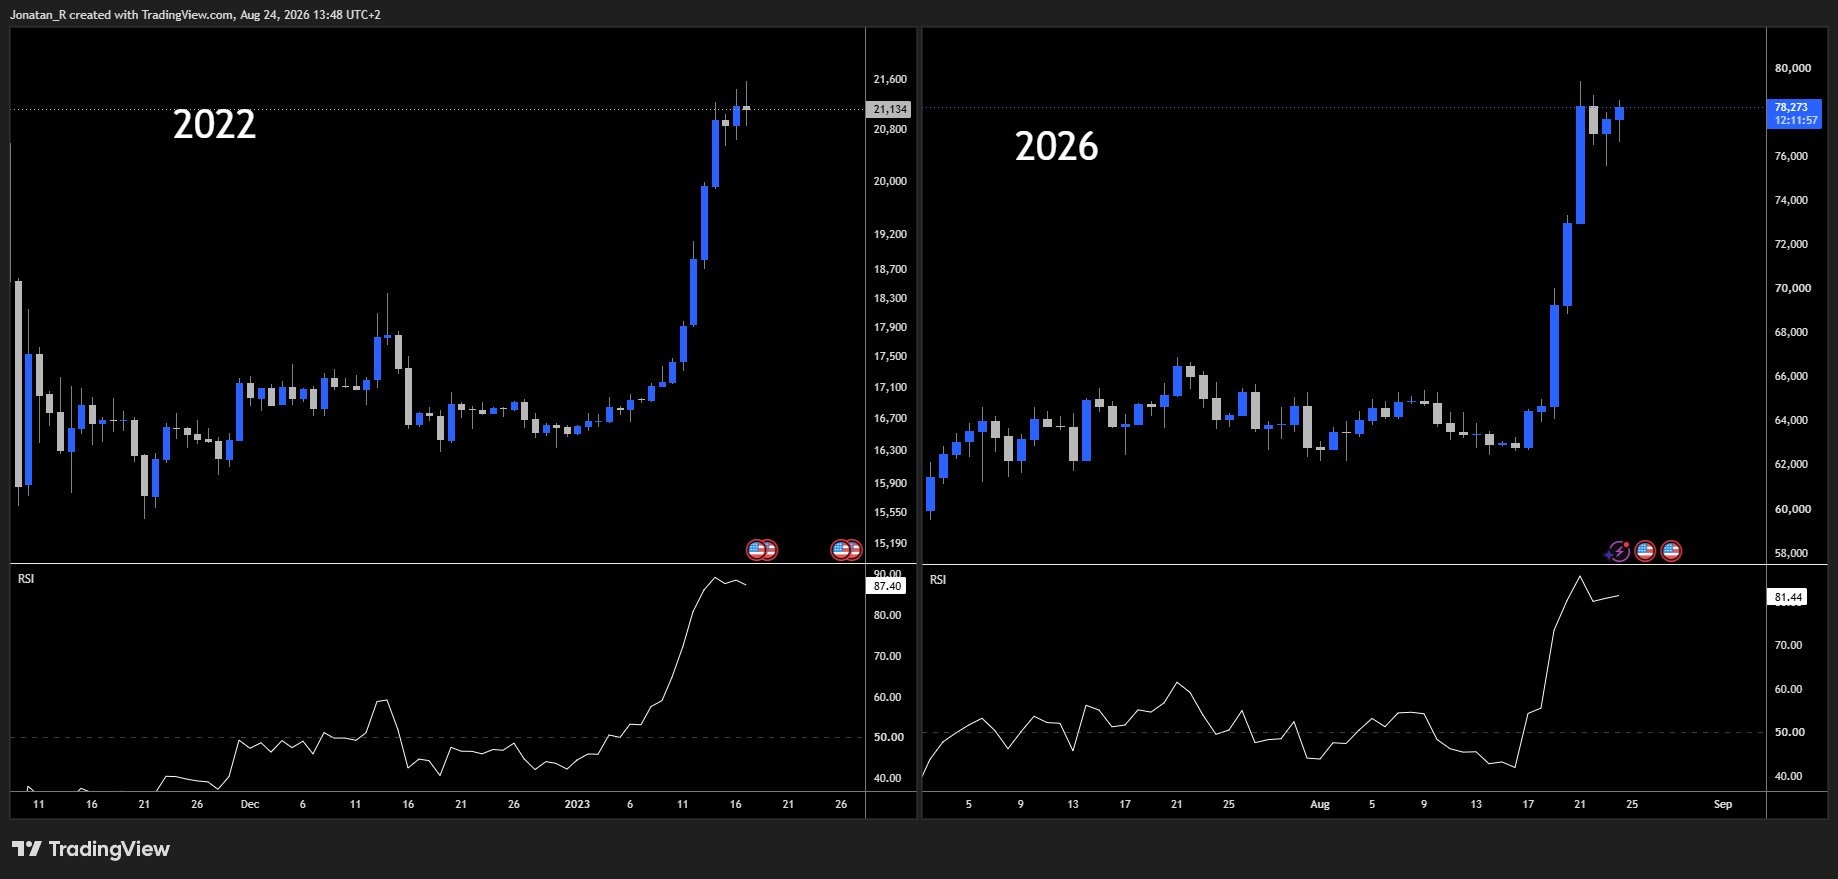
BTC/USD RSI comparison chart. Source: Jonatan Randin on X.com
Stochastic RSI prints anticipated crossover
Previously, Cointelegraph reported on expectations that Bitcoin’s two-month stochastic RSI indicator would repeat historical patterns to provide a clear signal over the end of the bear market.
Related: First bear-market trend line reclaim since 2025: Five things to know in Bitcoin this week
Stochastic RSI privileges more recent price moves, with a crossover of its two constituent trend lines acting as a cue for bullish trend change. This event has now occurred. However, the indicator reached only 4.81, avoiding the macro lows near zero that preceded previous crossovers.
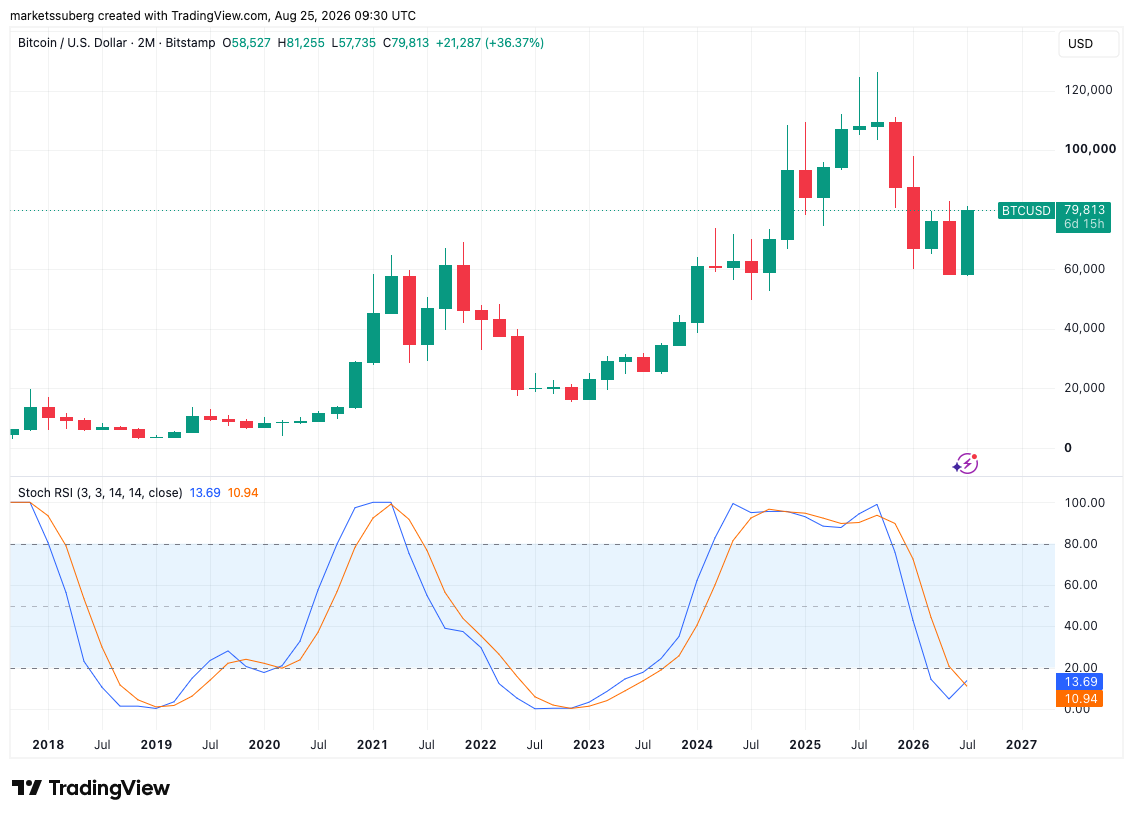
BTC/USD two-month chart with stochastic RSI data. Source: Cointelegraph/TradingView